How to get Twitter (X) data for sentiment analysis

When a product fails publicly, Twitter (X) is usually the first place it shows up. Not the press. Not review sites. Twitter. Within hours, a single product flaw can spawn thousands of tweets, drive a hashtag into the top ten trends in three countries, and permanently shift how a brand is perceived.
That's why researchers, brand managers, journalists, and quantitative analysts all want the same thing: reliable Twitter data, fast, and at scale.
The problem is that getting that data has never been harder or more expensive. Twitter's own Application Programming Interface (API) now costs anywhere from 5,000 per month, and even then, it doesn't give you clean, structured trend data. Do-it-yourself scrapers require proxies, constant maintenance, and a tolerance for early-morning debugging sessions when Twitter changes its UI without warning.
This article is about a smarter path. You'll learn what kinds of Twitter data are most useful for sentiment analysis, how the main collection methods compare, and how to get structured, real-time Twitter trend data using the Twitter (X) Trends Scraper (PPE) on Apify - in under five minutes, with no setup.
What is Twitter sentiment analysis?
Sentiment analysis is the process of using natural language processing (NLP) or large language models (LLMs) to automatically classify the emotional tone behind a piece of text - typically as positive, negative, or neutral. When applied to Twitter, it turns raw social data into measurable public opinion signals.

Twitter (X) data for sentiment analysis
Twitter (X) is uniquely valuable for this because people say what they actually think there. Unlike LinkedIn, where professional image management dominates, or product review sites, where feedback is structured and often incentivized, Twitter is where unfiltered reactions occur in real-time. A product launch, a policy announcement, a celebrity controversy - they all land on Twitter first.
Two distinct types of Twitter data matter for sentiment analysis:
-
Tweet content - the actual text of individual tweets, replies, quote-tweets, and threads posted about a topic, keyword, or brand. This is what most sentiment analysis tutorials focus on. You scrape tweets, run them through a classifier, and obtain a sentiment label for each tweet.
-
Trending topic data - the ranked list of hashtags and topics that are dominating conversation in a specific location at a specific point in time. This includes the trend rank, name, tweet count, and hourly history. I wrote an article on how to get Twitter (X) Trends Without Breaking the Bank.
Why trend data is an underrated input for sentiment analysis
Here's a question most sentiment analysis tutorials skip: what if you don't know which topic to analyze yet?
Tweet-level sentiment analysis works well when you already have a clear target - a brand name, a product, a specific hashtag. But trend data answers a different and often more valuable question: What are people talking about right now, and how intense is that conversation? That intensity is itself a sentiment signal.
Consider this: #ProductX is trending in São Paulo with 45k tweets and rising. You don't need to read a single tweet to know something significant is happening. The trend data alone indicate that a significant number of people are discussing this topic simultaneously, which almost always reflects a strong emotional reaction - positive or negative.
Here's what trend data actually reveals:
Tweet count as a proxy for emotional intensity. High tweet counts on a trending topic consistently correlate with strong emotional reactions. A hashtag with 80k tweets is generating far more sentiment "energy" than one with 2k. That count becomes your first filter for what's worth analyzing in depth.
Hourly trend history reveals sentiment momentum. The Twitter (X) Trends Scraper (PPE) captures trends across hourly snapshots, not just the current moment. A trend that appears at rank 40 with 5k tweets and climbs to rank 3 with 50k tweets in two hours signals something going viral. A trend that hits rank 1 and then rapidly falls often signals a controversy that burned hot and fast. These patterns are distinct and actionable.
Location-based trends reveal geographic sentiment clusters. A consumer product campaign trending in New York but not in London, or a political hashtag dominating Lagos but absent in Nairobi, gives you geographic precision that tweet-level analysis rarely provides without significant pre-processing.
Practical use cases where trend data drives sentiment decisions:
- Brand monitoring: Catch a PR crisis developing before it peaks, while you still have time to respond.
- Product launch tracking: See whether your campaign is gaining traction geographically, not just globally.
- Competitor intelligence: Know the moment your competitor's brand starts trending - and with what intensity.
- Academic research: Track regional public opinion on political events, elections, or policy announcements.
- Content strategy: Identify topics with proven high engagement before committing creative resources to them.
So what does an effective data collection strategy actually look like?
Methods for getting Twitter (X) data
There are three realistic options for collecting Twitter data at scale. Here's an honest comparison.
The official X API
The X API is Twitter's own data access layer. It gives you structured, compliant access to tweets, user profiles, and some trend data via REST and streaming endpoints.
The problem is the pricing model. The free tier is limited to 1,500 tweets per month for write-only access - virtually useless for sentiment analysis. The Basic plan costs $100.00 per month and gives you limited read access. The Pro plan, which provides meaningful volume, costs $5,000.00 per month. Enterprise pricing isn't even listed publicly.
For trend data specifically, the API provides access to the trends/place endpoint, but it's been progressively restricted alongside the broader API changes since 2023.
Best for: Enterprise teams with compliance requirements who need guaranteed terms-of-service alignment and have the budget to justify it.
DIY web scraping
You could write your own scraper using tools like Selenium or Playwright to automate a browser, log in to Twitter, and extract trend data from the web interface.
The appeal is obvious: potentially free and fully flexible. The reality is less appealing. Twitter's front-end changes frequently, and every UI update risks breaking your scraper. To avoid IP blocks, you'll need rotating residential proxies, which can cost hundreds of dollars per month on their own. And all of that assumes you have the time and technical skill to build and maintain the scraper indefinitely.
Best for: Developers who treat scraper maintenance as a learning exercise rather than a cost.
Ready-made Apify Actors
Apify Actors are pre-built, cloud-hosted scrapers maintained by their developers and hosted on the Apify platform. They handle proxy management, authentication avoidance, output formatting, and cloud execution - so you don't have to.
The Twitter (X) Trends Scraper (PPE) is exactly this kind of tool. It was built specifically to extract real-time trending topic data from Twitter, supports granular location targeting across hundreds of countries and cities, and requires zero configuration beyond selecting your location.
Operating on a pay-per-event model (starting from $1.00 per 1,000 results), it is a fraction of the cost of the Pro API plan - and delivers trend data the API doesn't even expose cleanly. You only pay for the successful scrapes you actually perform.
Best for: Researchers, marketers, and developers who need reliable data without infrastructure overhead or expensive monthly subscriptions.
At a glance: method comparison
| Official X API | DIY scraping | Apify Actor (PPE) | |
|---|---|---|---|
| Cost | 5,000+/month | "Free" + proxy costs | From $1.00 per 1,000 results |
| Trend data quality | Limited, restricted since 2023 | Variable (breaks on UI changes) | Structured, real-time, hourly history |
| Setup complexity | High (API keys, OAuth, rate limits) | Very high (proxies, parsing, maintenance) | None (click to run) |
| Maintenance burden | Low (API is stable until deprecated) | High (breaks on any UI update) | None (maintained by developer) |
| Location targeting | Country-level only | Depends on implementation | 300+ countries and cities |
| Structured output | Yes (JSON) | Manual (requires parsing) | Yes (JSON, CSV, Excel, Sheets) |
| ToS compliance | ✅ Fully compliant | ⚠️ Gray area | ✅ Public data only |
| Best for | Enterprise compliance-first teams | Developers who enjoy scraper maintenance | Researchers, marketers, and developers |
How to use the Twitter (X) Trends Scraper (PPE) to get data for sentiment analysis
The Twitter (X) Trends Scraper (PPE) extracts real-time trending topics from Twitter (X) for any country or city in its location list. It captures trend rank, hashtag names, tweet counts, direct search links, and a rolling hourly history - making it directly useful as a sentiment intensity tracker rather than just a static snapshot tool.
Here's how to get your first dataset.
Step 1: Access the Actor
Go to Apify Store and search for "Twitter (X) Trends Scraper (PPE)", or navigate directly to apify.com/eunit/x-twitter-trends-ppe.
If you don't already have an Apify account, sign up for free. No credit card is required to start the trial. Once on the Actor page, click Try for free.
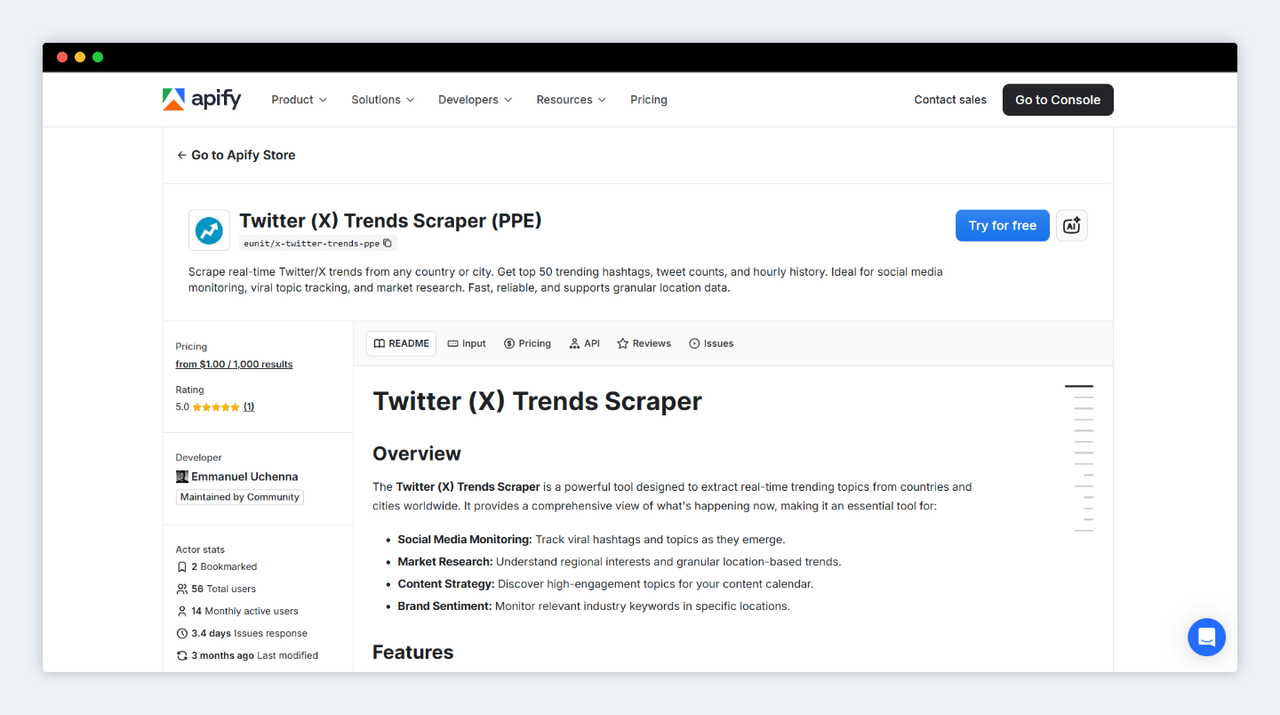
Twitter (X) Trends Scraper (PPE) on Apify
Step 2: Configure your input
The input form has a single field: Country / City. This simplicity is intentional - the Actor is designed to return complete trend data for your selected location in one run.
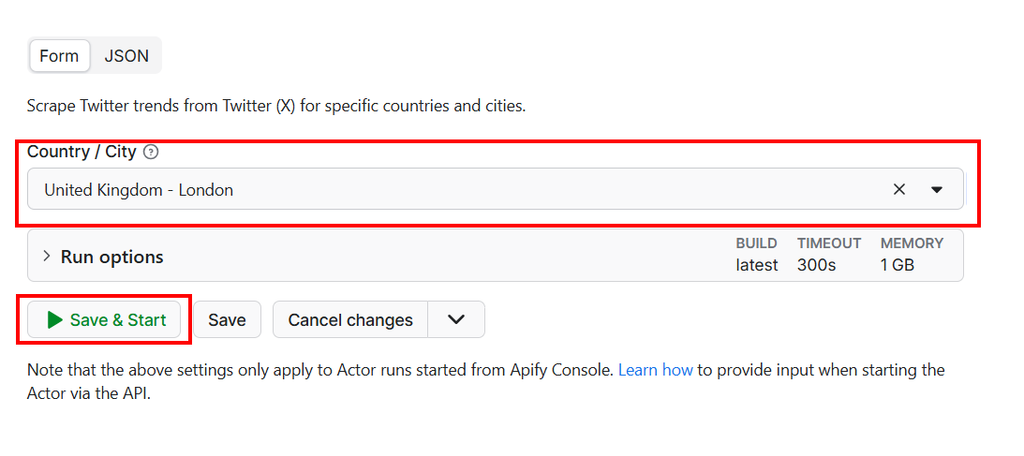
Configure input for Twitter (X) Trends Scraper (PPE)
The dropdown supports a wide range of locations, from top-level country selections like Worldwide or united-kingdom, to city-level targeting such as united-states/new-york, nigeria/lagos, or india/mumbai.
For sentiment analysis purposes, location selection strategy matters:
- If you're monitoring a brand or product, start with
Worldwideto establish whether the topic is trending globally. - Then re-run with specific market locations (e.g.,
united-states,united-kingdom,australia) to understand where the conversation is concentrated.
The equivalent JSON input looks like this:
{
  "country": "united-states/new-york"
}
You can also pass this input directly via the API or Apify client libraries, which is covered in the automation section below.
Step 3: Run and inspect the output
Click Run. The Actor typically completes in seconds and returns a structured JSON dataset. Here's what each key field contains:
scraped_at- the UTC timestamp of the run. Critical for tracking data freshness and building time-series datasets.country_input- the location string you submitted, useful for multi-location runs.timeline- an array of hourly snapshots, each containing up to 50 ranked trends. Each trend includes itsrank,name(the hashtag or topic),tweet_count, and a direct searchlink. This is the richest output for sentiment analysis.tag_cloud- a broader set of trending terms for that location, useful for topic discovery.table_data- the current top 50 ranked trends in a flat table format, ideal for quick dashboards.
A sample of the timeline output:
{
  "scraped_at": "2026-04-03T10:30:00.000Z",
  "country_input": "united-states/new-york",
  "timeline": [
    {
      "datetime": "2 minutes ago",
      "timestamp": "1743672600",
      "trends": [
        {
          "rank": 1,
          "name": "#TechLayoffs",
          "link": "https://twitter.com/search?q=%23TechLayoffs",
          "tweet_count": "82K"
        },
        {
          "rank": 2,
          "name": "New York Giants",
          "link": "https://twitter.com/search?q=%22New+York+Giants%22",
          "tweet_count": "14K"
        }
      ]
    }
  ]
}
Step 4: Export and use the data
Once the run completes, Apify Console gives you several export options directly from the dataset view: JSON, CSV, Excel, XML, and a direct Google Sheets integration.
For sentiment analysis pipelines, JSON or CSV are the most practical formats. JSON preserves the nested timeline structure (essential if you're tracking momentum across hourly snapshots), while CSV flattens the data for easy import into tools like Excel, Google Sheets, or pandas.
Tip: For a fully automated pipeline - where you scrape trends, then instantly analyze the sentiment of trending topics without writing any code - connect this Actor with LLM Dataset Processor directly in Apify Console. Point the LLM processor at your trend dataset, define a prompt like
"Classify the likely sentiment associated with this trending hashtag as Positive, Negative, or Neutral based on context", and export the enriched results to Google Sheets automatically.
For developers: automating the pipeline
If you want to integrate live Twitter trend data into your own application or run it on a schedule, Apify provides client libraries for Python and JavaScript that make this straightforward.
First, install the Python client:
pip install apify-client
Then run the Actor programmatically:
from apify_client import ApifyClient

# Initialize the client with your Apify API token
client = ApifyClient("<YOUR_API_TOKEN>")

# Define your input
run_input = {
    "country": "united-states/new-york",
}

# Run the Actor and wait for completion
run = client.actor("eunit/x-twitter-trends-ppe").call(run_input=run_input)

# Fetch and process the results
for item in client.dataset(run["defaultDatasetId"]).iterate_items():
    print(f"Trends for: {item['country_input']}")
    for trend in item["timeline"][0]["trends"][:10]:
        print(f"  #{trend['rank']} {trend['name']} - {trend['tweet_count']} tweets")
For JavaScript/Node.js projects, the pattern is identical using the apify-client npm package:
import { ApifyClient } from 'apify-client';

const client = new ApifyClient({ token: '<YOUR_API_TOKEN>' });

const run = await client.actor("eunit/x-twitter-trends-ppe").call({
    country: "united-states/new-york",
});

const { items } = await client.dataset(run.defaultDatasetId).listItems();
items.forEach(item => {
    item.timeline[0].trends.slice(0, 10).forEach(trend => {
        console.log(`#${trend.rank} ${trend.name} - ${trend.tweet_count}`);
    });
});
Scheduling for longitudinal datasets. The real power for sentiment analysis is in running the Actor on a regular cadence - say, every hour - and storing the results in a database or data warehouse. This builds a time-series dataset of trend rank and tweet count, which lets you track sentiment momentum over hours, days, or weeks. Apify's built-in scheduler handles this without external cron jobs or infrastructure.
AI agent integration. If you're building an AI agent that needs to be aware of current social trends, the Actor supports Model Context Protocol (MCP) server integration. Your agent can query live trend data and use it as context for downstream reasoning tasks.
Is it legal to scrape Twitter (X) trends?
This is a fair question, and it deserves a direct answer.
The Twitter (X) Trends Scraper (PPE) collects publicly available, factual data - specifically the list of trending hashtags and topics that Twitter displays to any unauthenticated visitor. It does not scrape private profiles, direct messages, content behind a login wall, or any personally identifiable information.
Scraping publicly available factual data is generally considered legal in most jurisdictions. The landmark hiQ Labs v. LinkedIn case in the United States established that scraping publicly available data does not constitute a violation of the Computer Fraud and Abuse Act (CFAA). Trend data - hashtag names, rankings, and aggregate tweet counts - is about as factual and public as data gets.
That said, you should always review the Terms of Service of any platform you interact with, and ensure your use case complies with applicable regulations. The General Data Protection Regulation (GDPR) and California Consumer Privacy Act (CCPA) govern personal data, not aggregated metadata like trend rankings and hashtag names. As long as you're collecting and using trend data responsibly, you're on solid ground.
Wrapping Up
The hardest part of any Twitter sentiment analysis project isn't the analysis. It's getting clean, reliable, structured data to analyze. The official API is prohibitively expensive for most teams. DIY scrapers are fragile and require time-consuming maintenance. And most sentiment analysis tutorials skip past the data collection problem entirely.
The Twitter (X) Trends Scraper (PPE) fills that gap directly. It gives you real-time Twitter trend data - ranked hashtags, tweet counts, hourly history, and location-level granularity - in a structured format that plugs directly into your sentiment pipeline, whether that's a Python NLP script, an LLM-powered classifier, or a no-code Apify workflow.
The free trial requires no credit card. A single run takes about ten seconds. And the data you get back can be the difference between catching a PR crisis before it peaks and reading about it in the Monday morning report.
Try the Twitter (X) Trends Scraper (PPE) on Apify and start turning Twitter's real-time noise into a clear, actionable signal.

Emmanuel Uchenna
@eunit99Hi, I’m Emmanuel Uchenna — a frontend engineer, technical writer, and digital health advocate passionate about building technology that empowers people. With over five years of experience, I specialize in crafting clean, scalable user interfaces with React, Next.js, and modern web tooling, while also translating complex technical ideas into clear, engaging content through articles, documentation, and whitepapers.